Data Portrait
Description
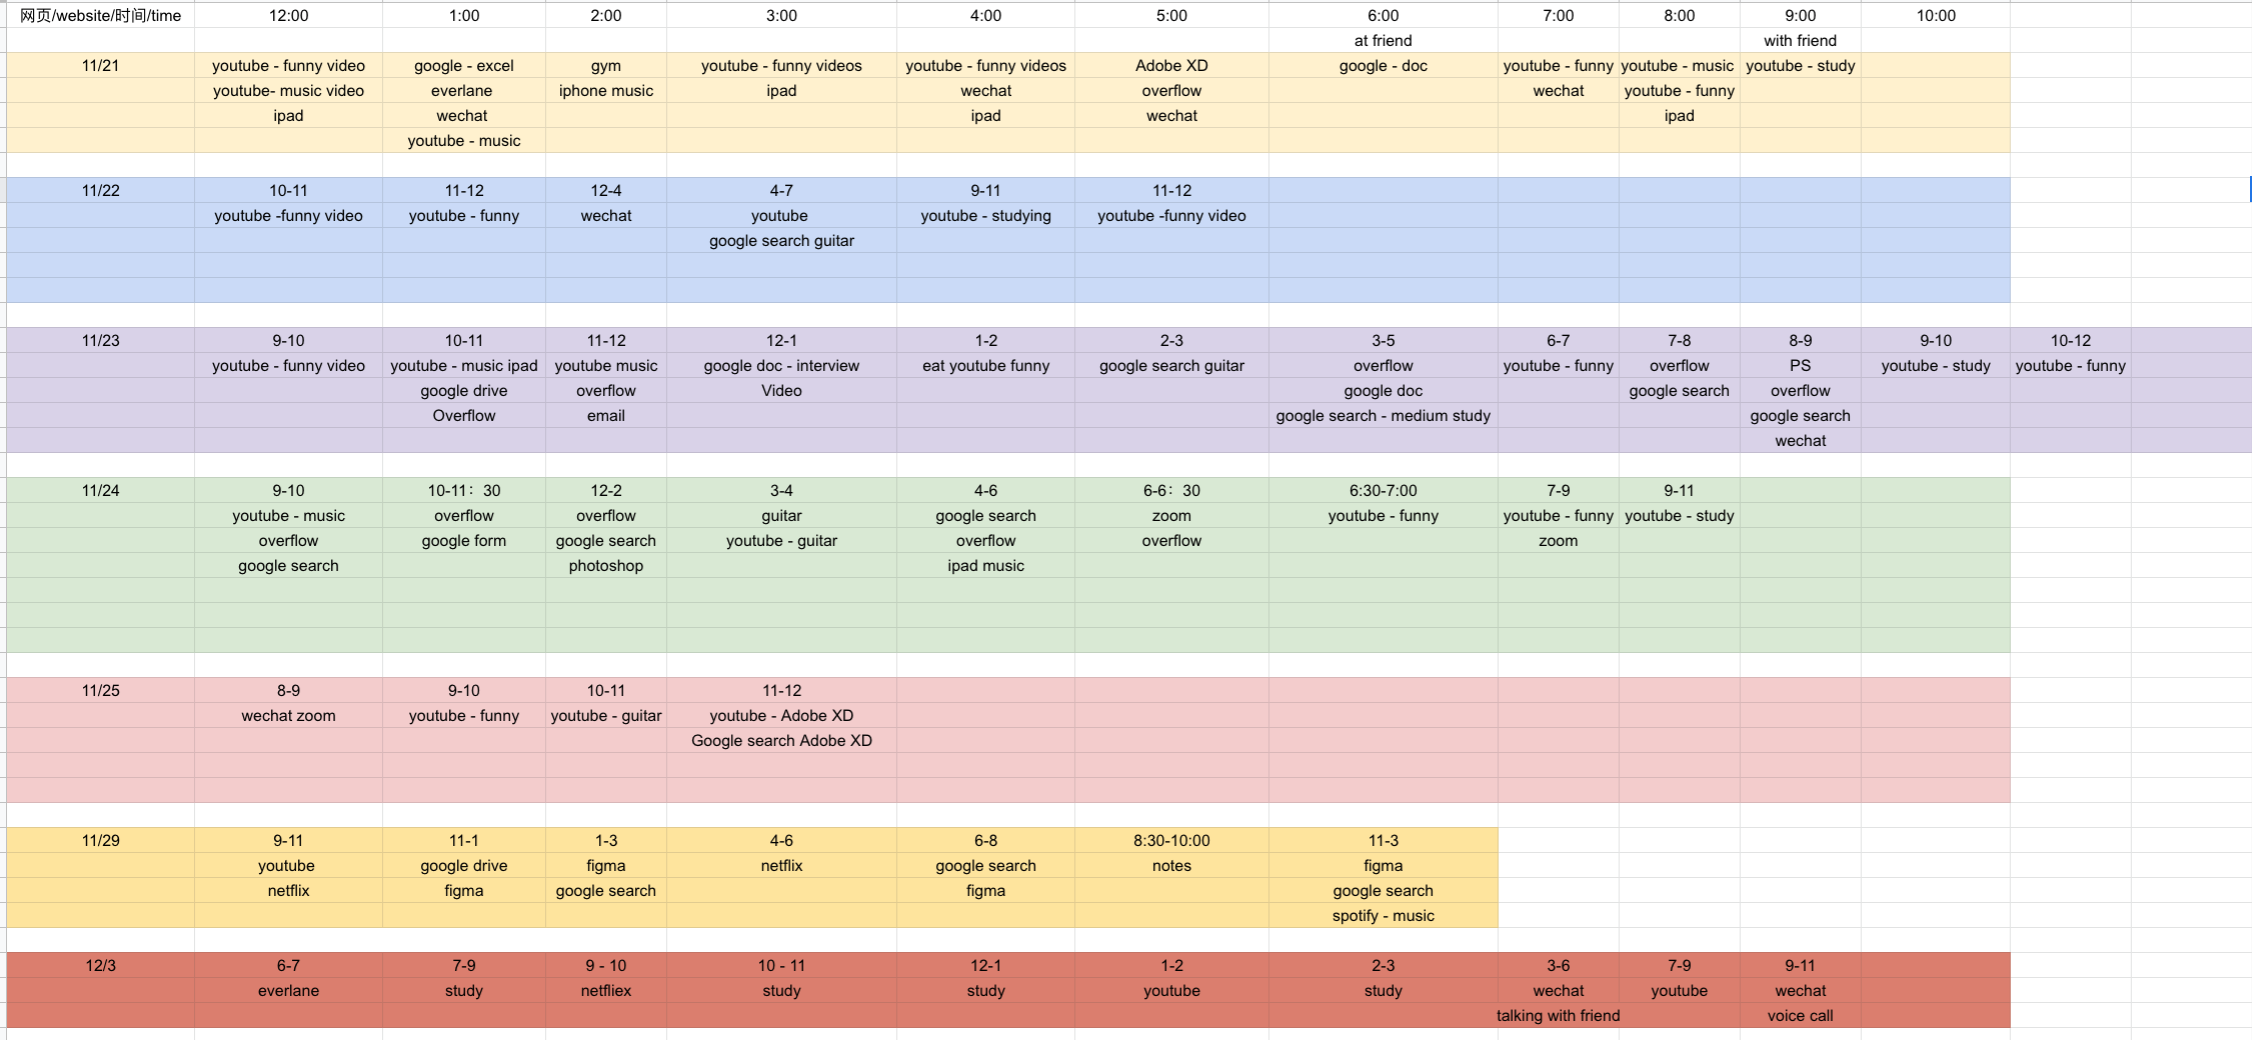
The graph above illustrated type of activities during each hours of my 7 days. As you can see I have a irregular schedule 😆😆.
Hover over on different colored square to see the percentage of each activity for 7 days.
The Blue Square: watching Youtube, Netflix, ect.
The Red Square: Studying, Zoom, Lectures.
The Yellow Square: socialize, wechat, Zoom, talking with roomates, ect.
Design Process
Using Excel to record my hourly activity.